Public School Data Analysis Report
This report analyzes California public school data to explore relationships between socioeconomic factors, teacher salaries, absence rates, and academic performance. The findings reveal several significant correlations that provide insights for educational policy and resource allocation decisions.
Key Findings
1. Socioeconomic Status Impact
Schools with higher percentages of socioeconomically disadvantaged students show significantly lower test scores in both Math and English Language Arts. The correlation values range from -0.76 to -0.84.
2. Teacher Salary Relationship
Higher teacher compensation appears to be associated with slightly better academic outcomes, though the relationship is not strong. This may suggest that while pay contributes to performance, other factors—like absenteeism or socioeconomic status—have greater influence.
3. Chronic Absence Impact
Higher chronic absence rates strongly correlate with lower test scores. The correlation values range from -0.39 to -0.48, indicating that regular attendance is an important factor in student achievement.
4. English Learner Absence & Disadvantage
Chronic absence rates among English Learners are moderately correlated with both the percentage of socioeconomically disadvantaged students (r ≈ 0.29) and lower test scores (r ≈ -0.39 for ELA, r ≈ -0.41 for Math). This suggests that schools with more disadvantaged students and higher English Learner absence face compounding challenges in academic achievement.
5. Absence Rate Patterns
Absence rates strongly correlate across different student groups (0.76-0.95), suggesting that absence issues tend to affect entire school populations rather than being isolated to specific demographic groups.
Data Visualizations
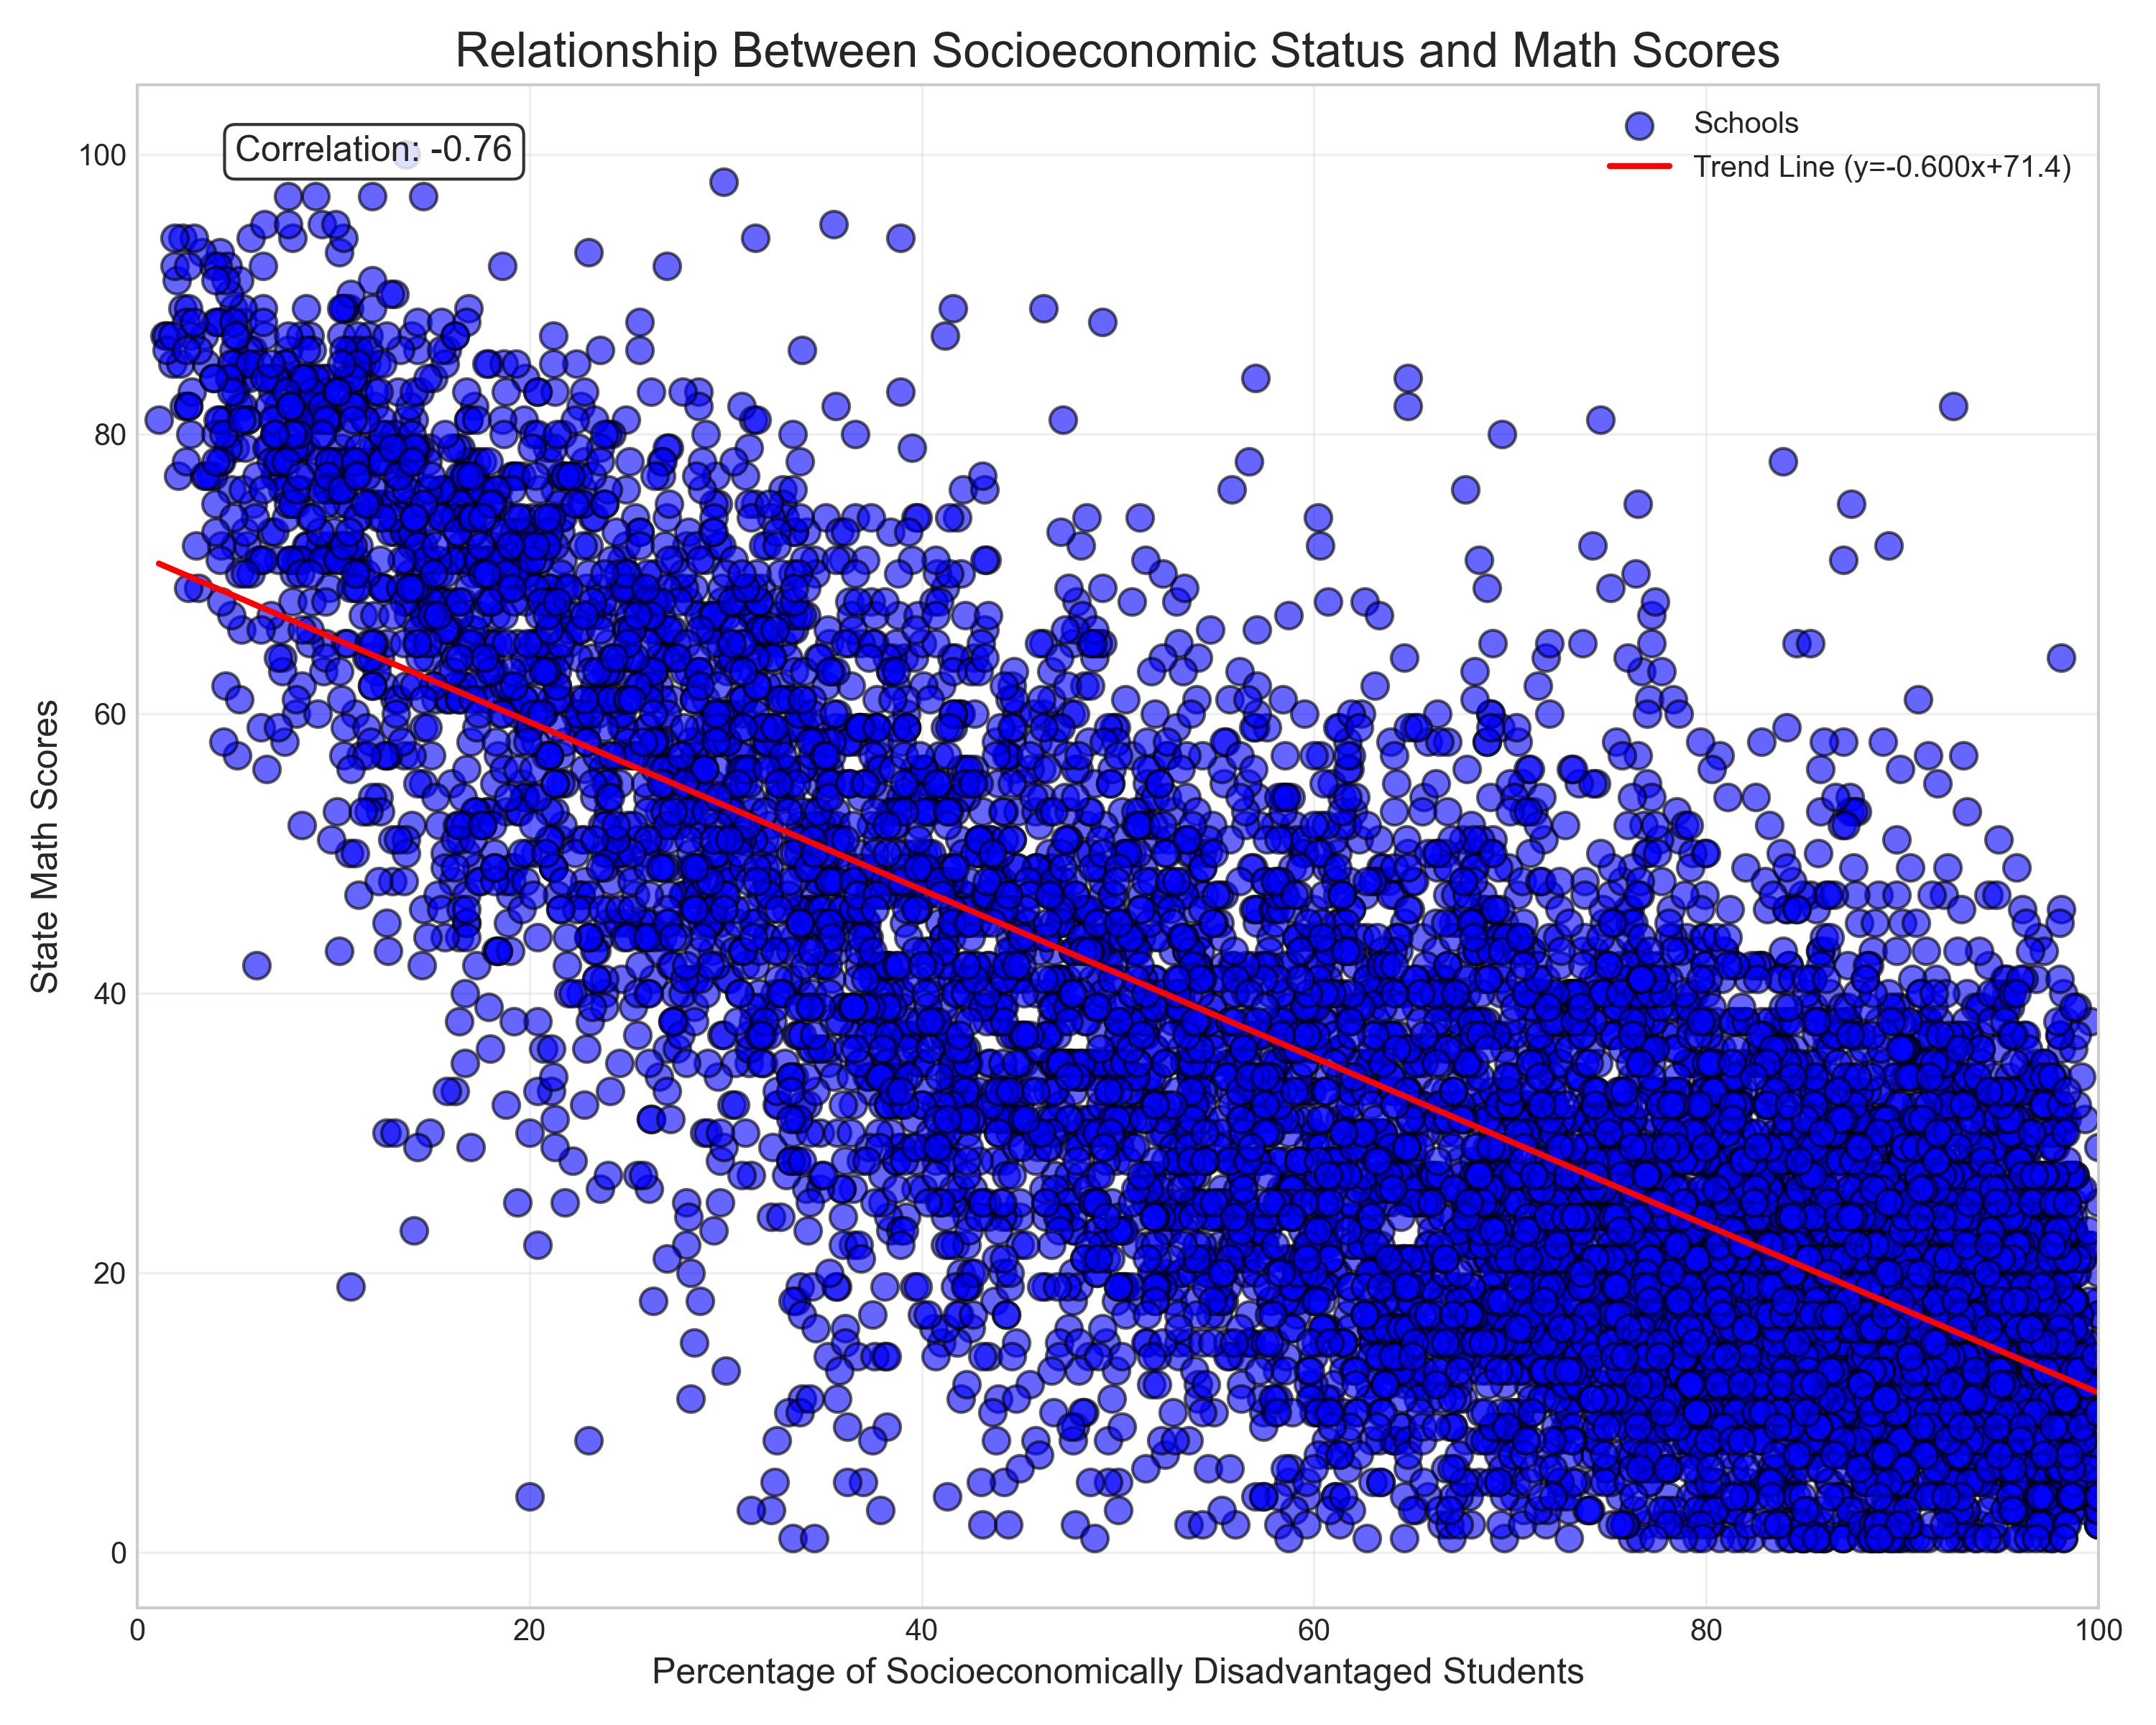
Figure 1: Relationship between socioeconomic status and math scores showing a strong negative correlation.
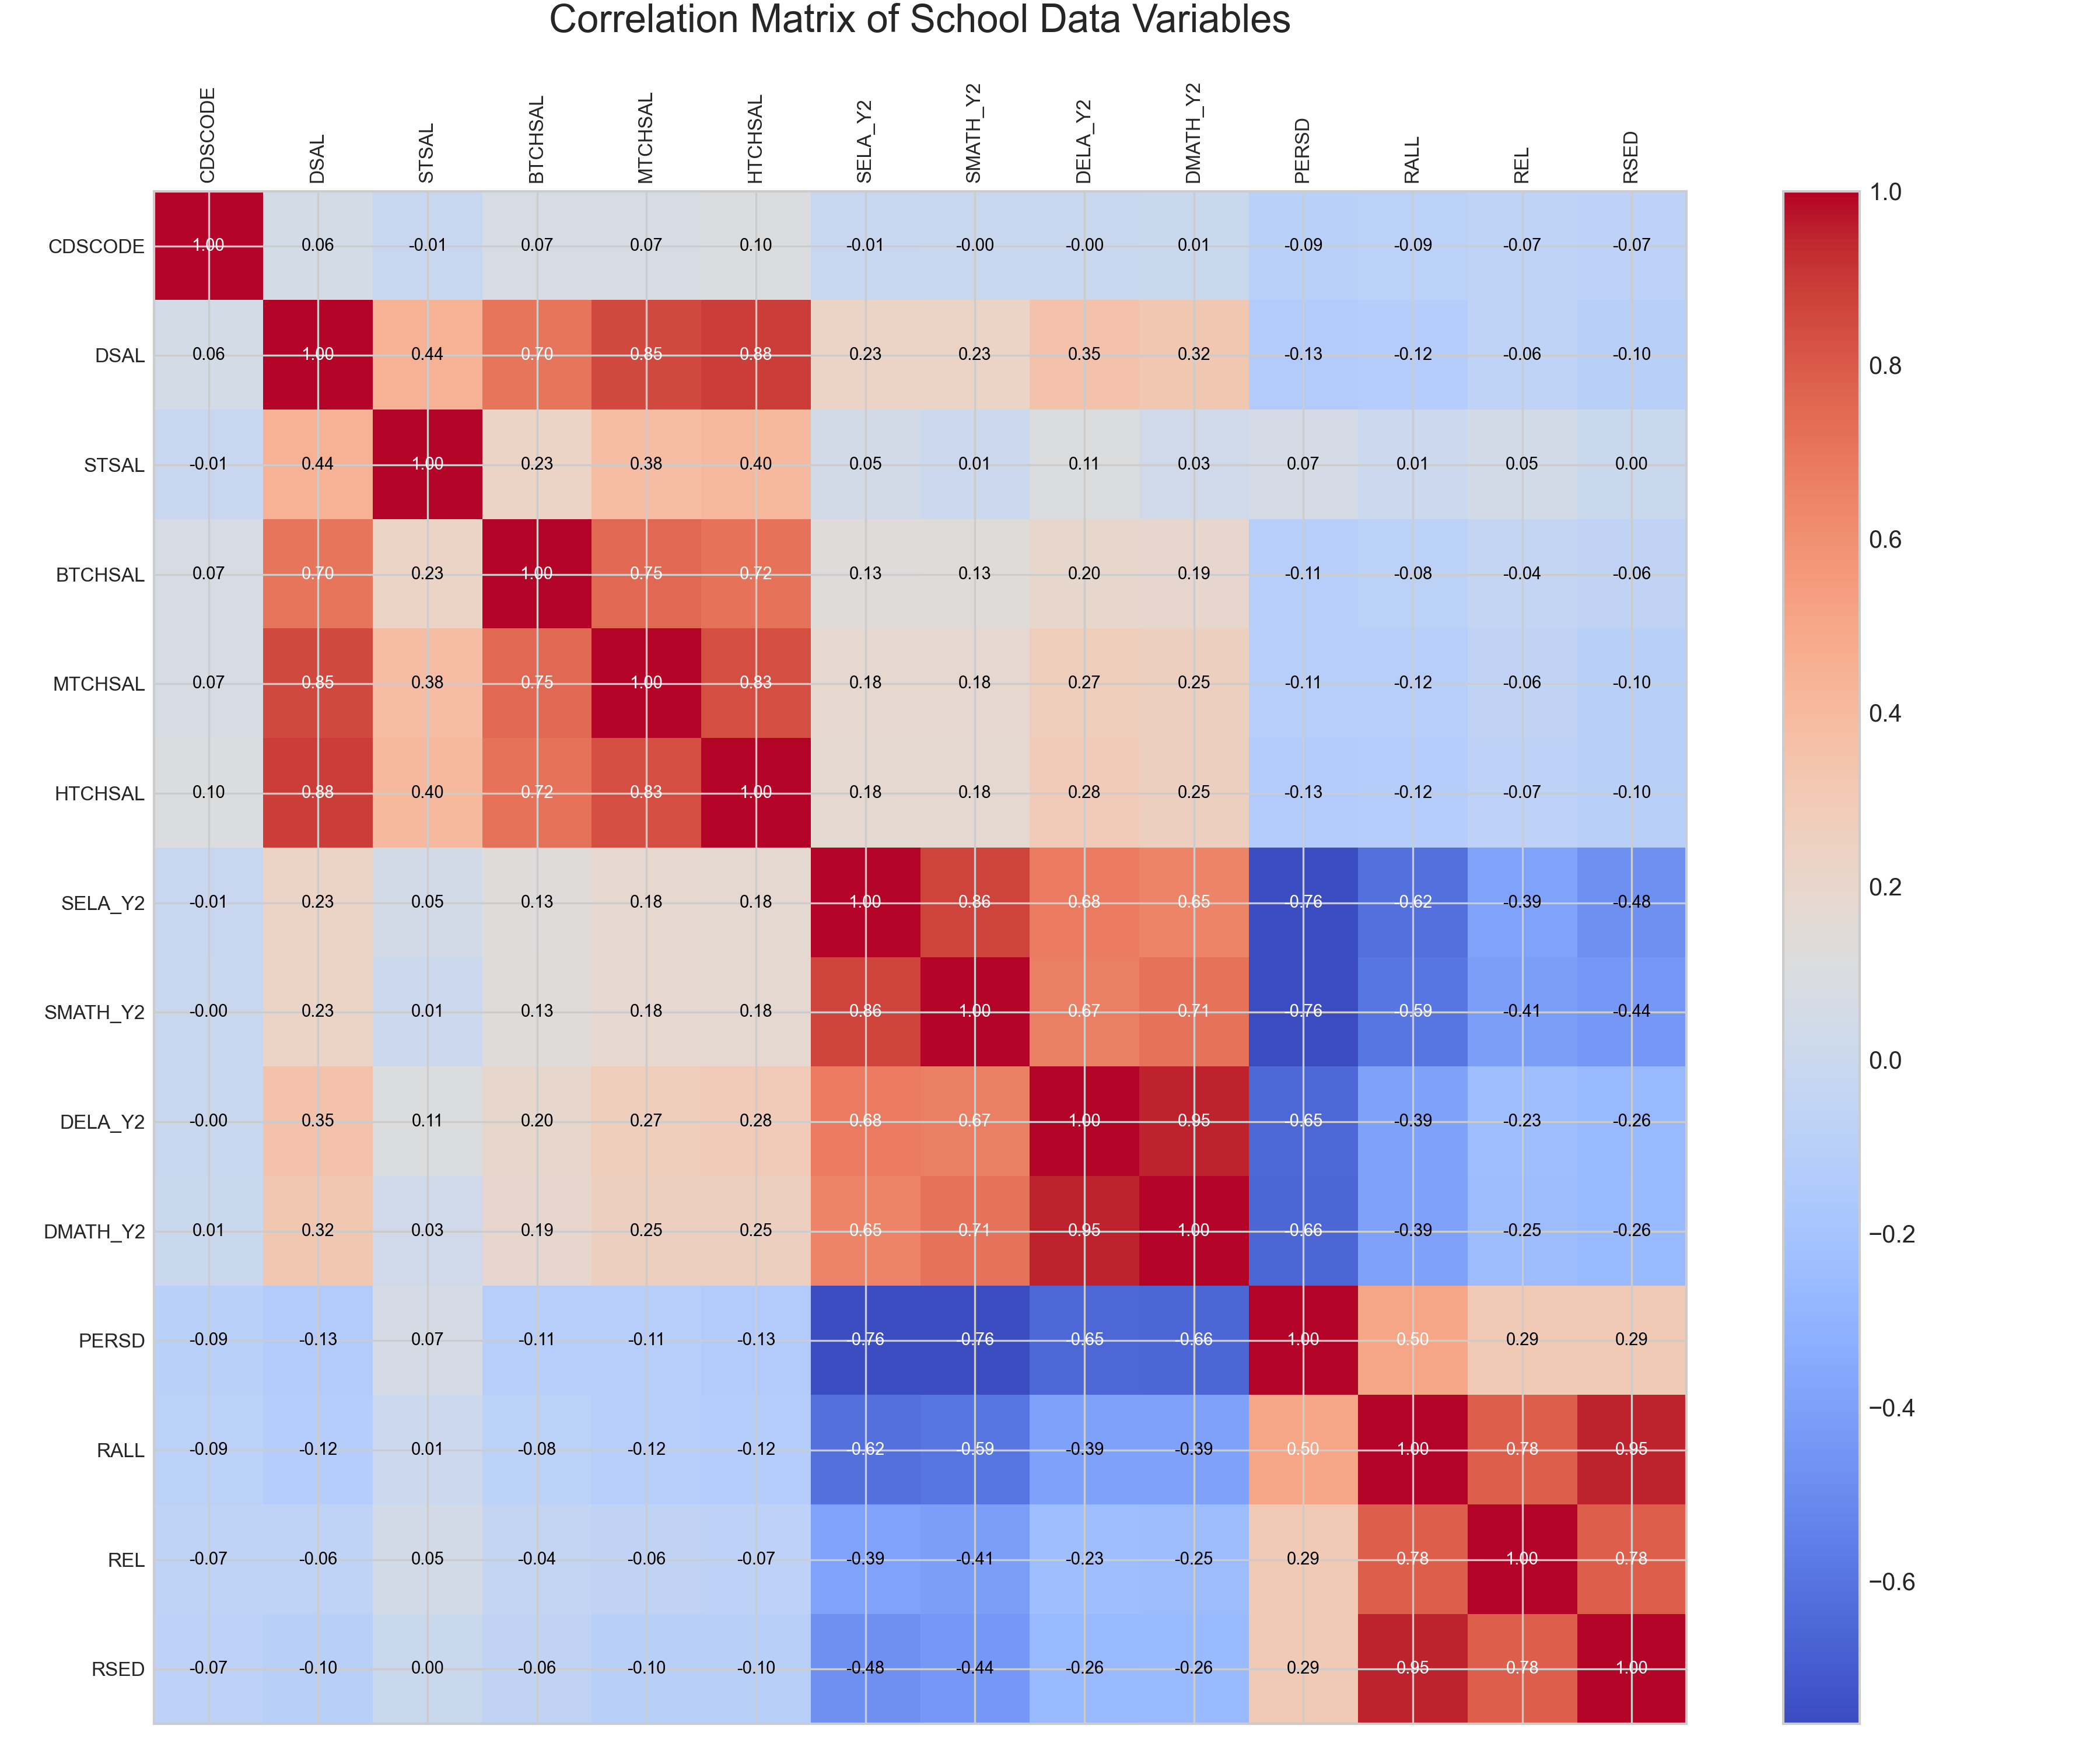
Figure 2: Correlation matrix showing relationships between various factors in the dataset.
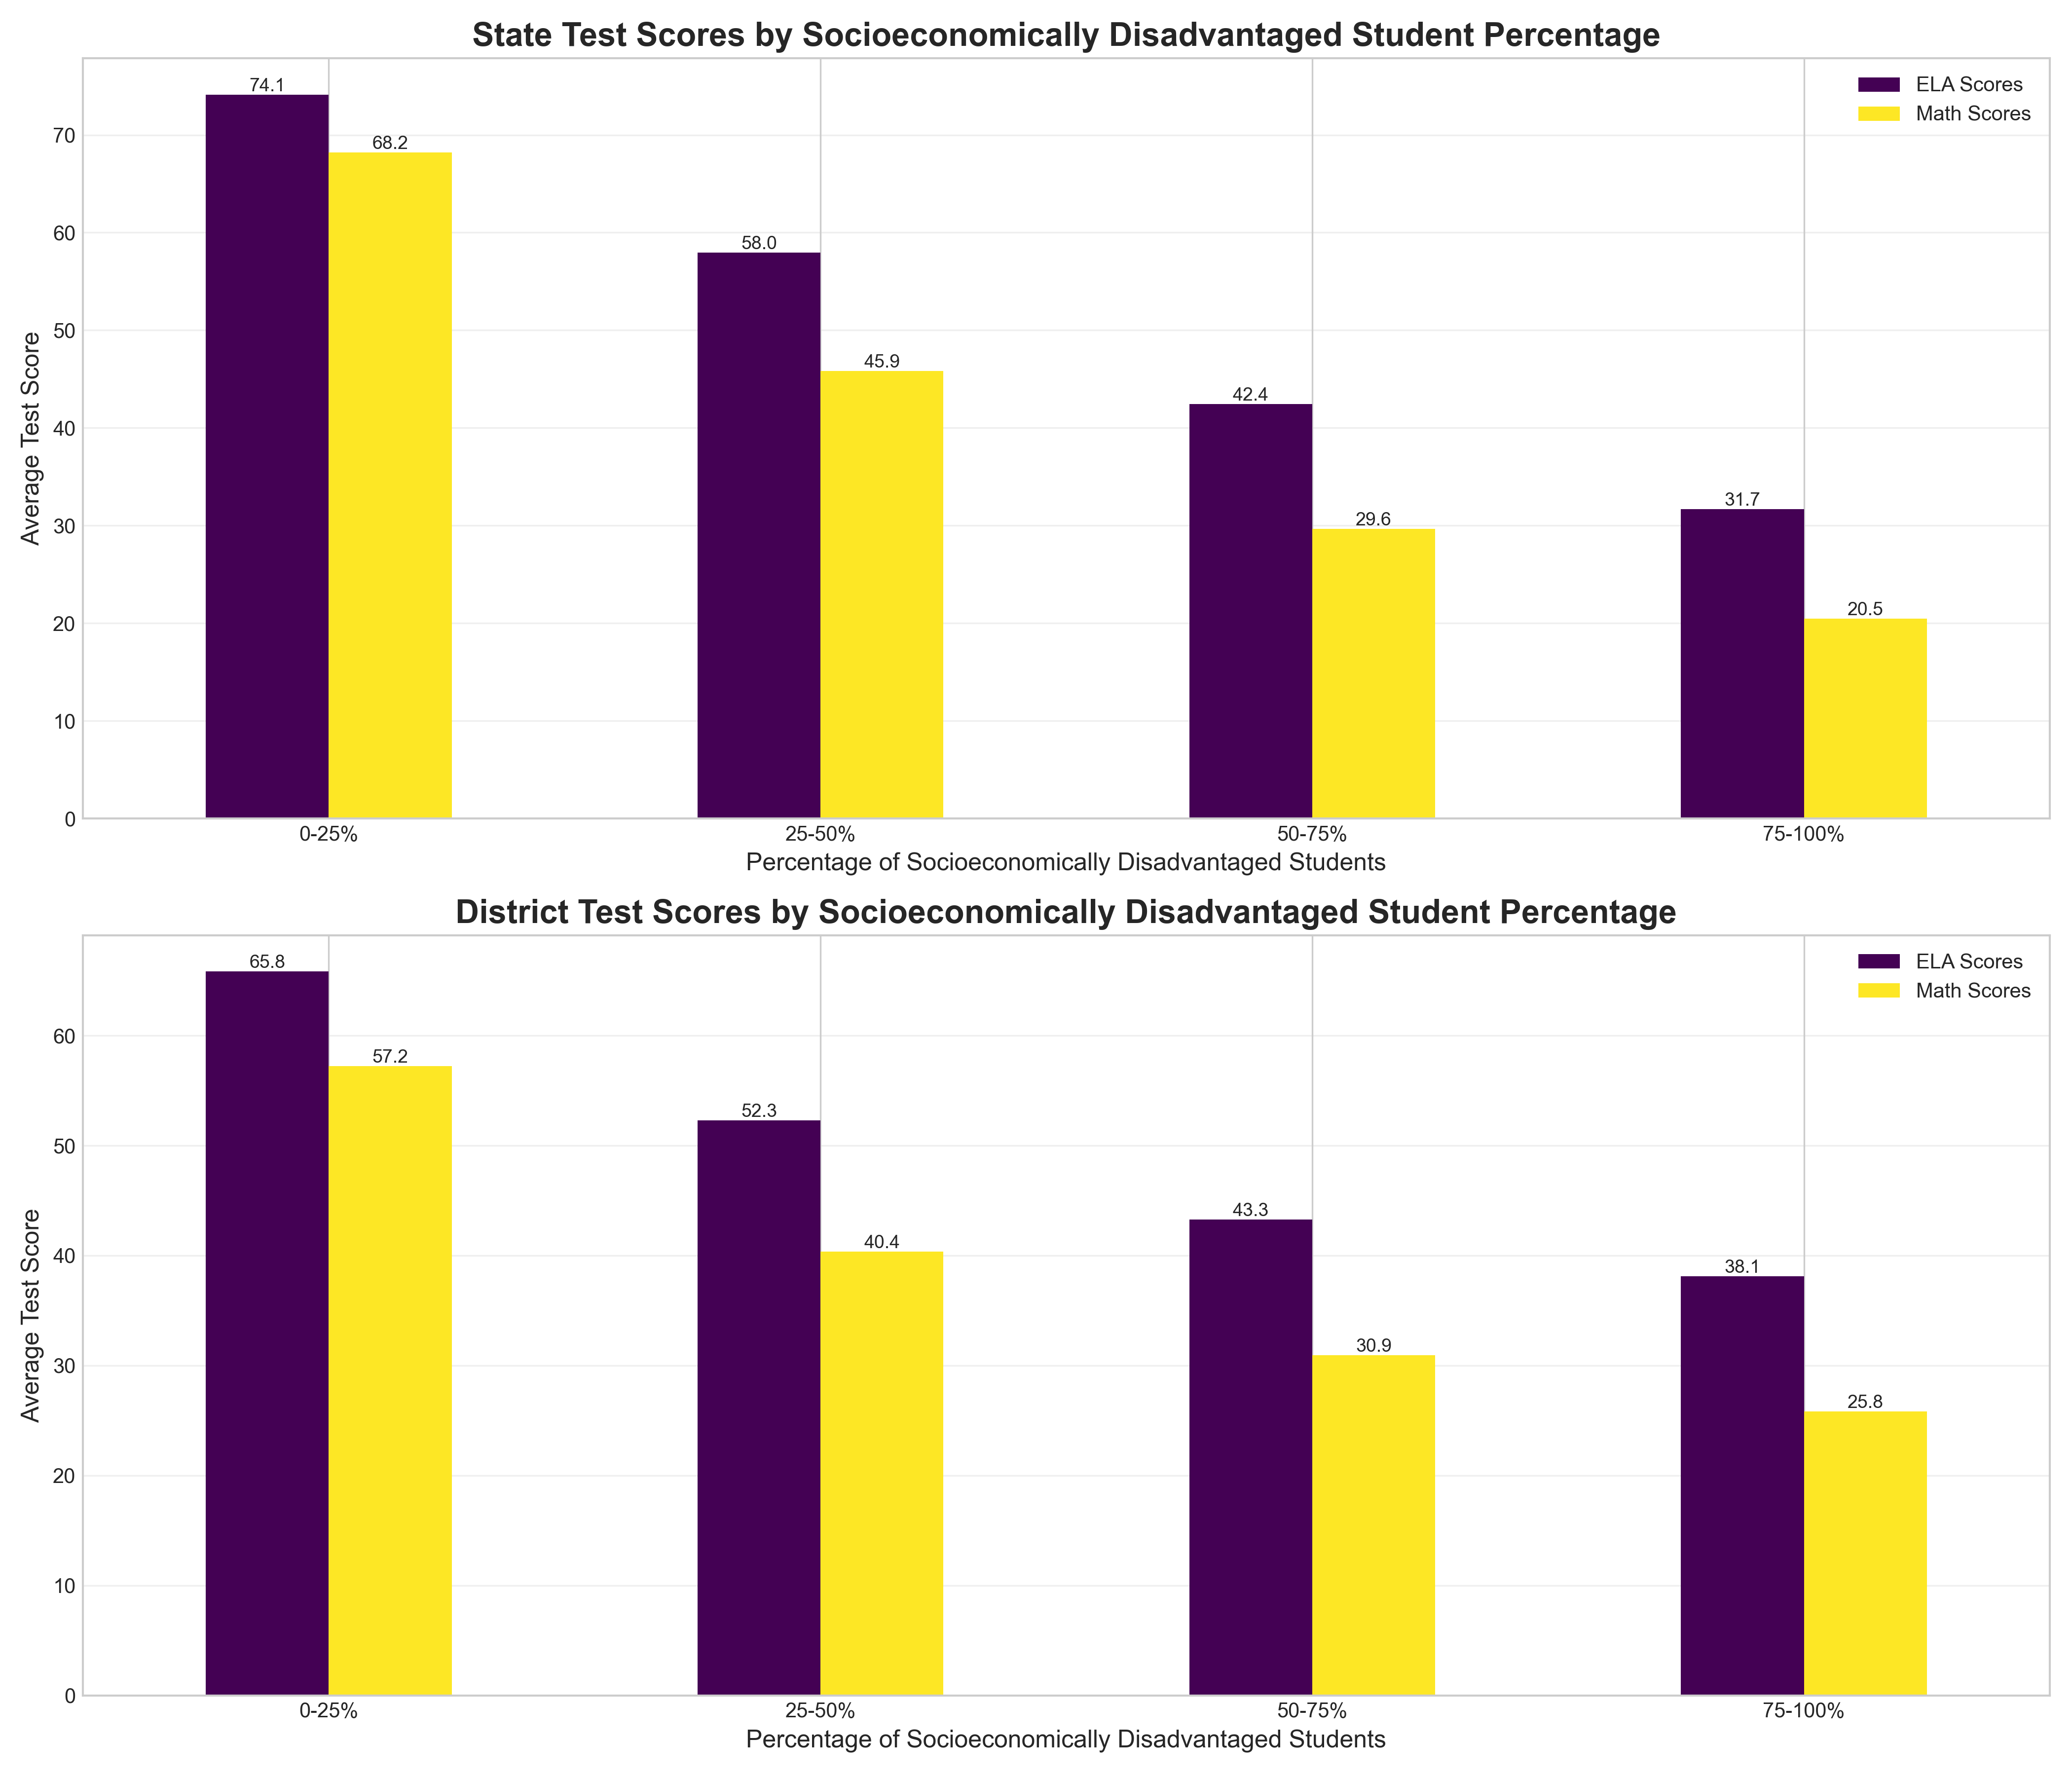
Figure 3: Average test scores by percentage of socioeconomically disadvantaged students (SED bins).
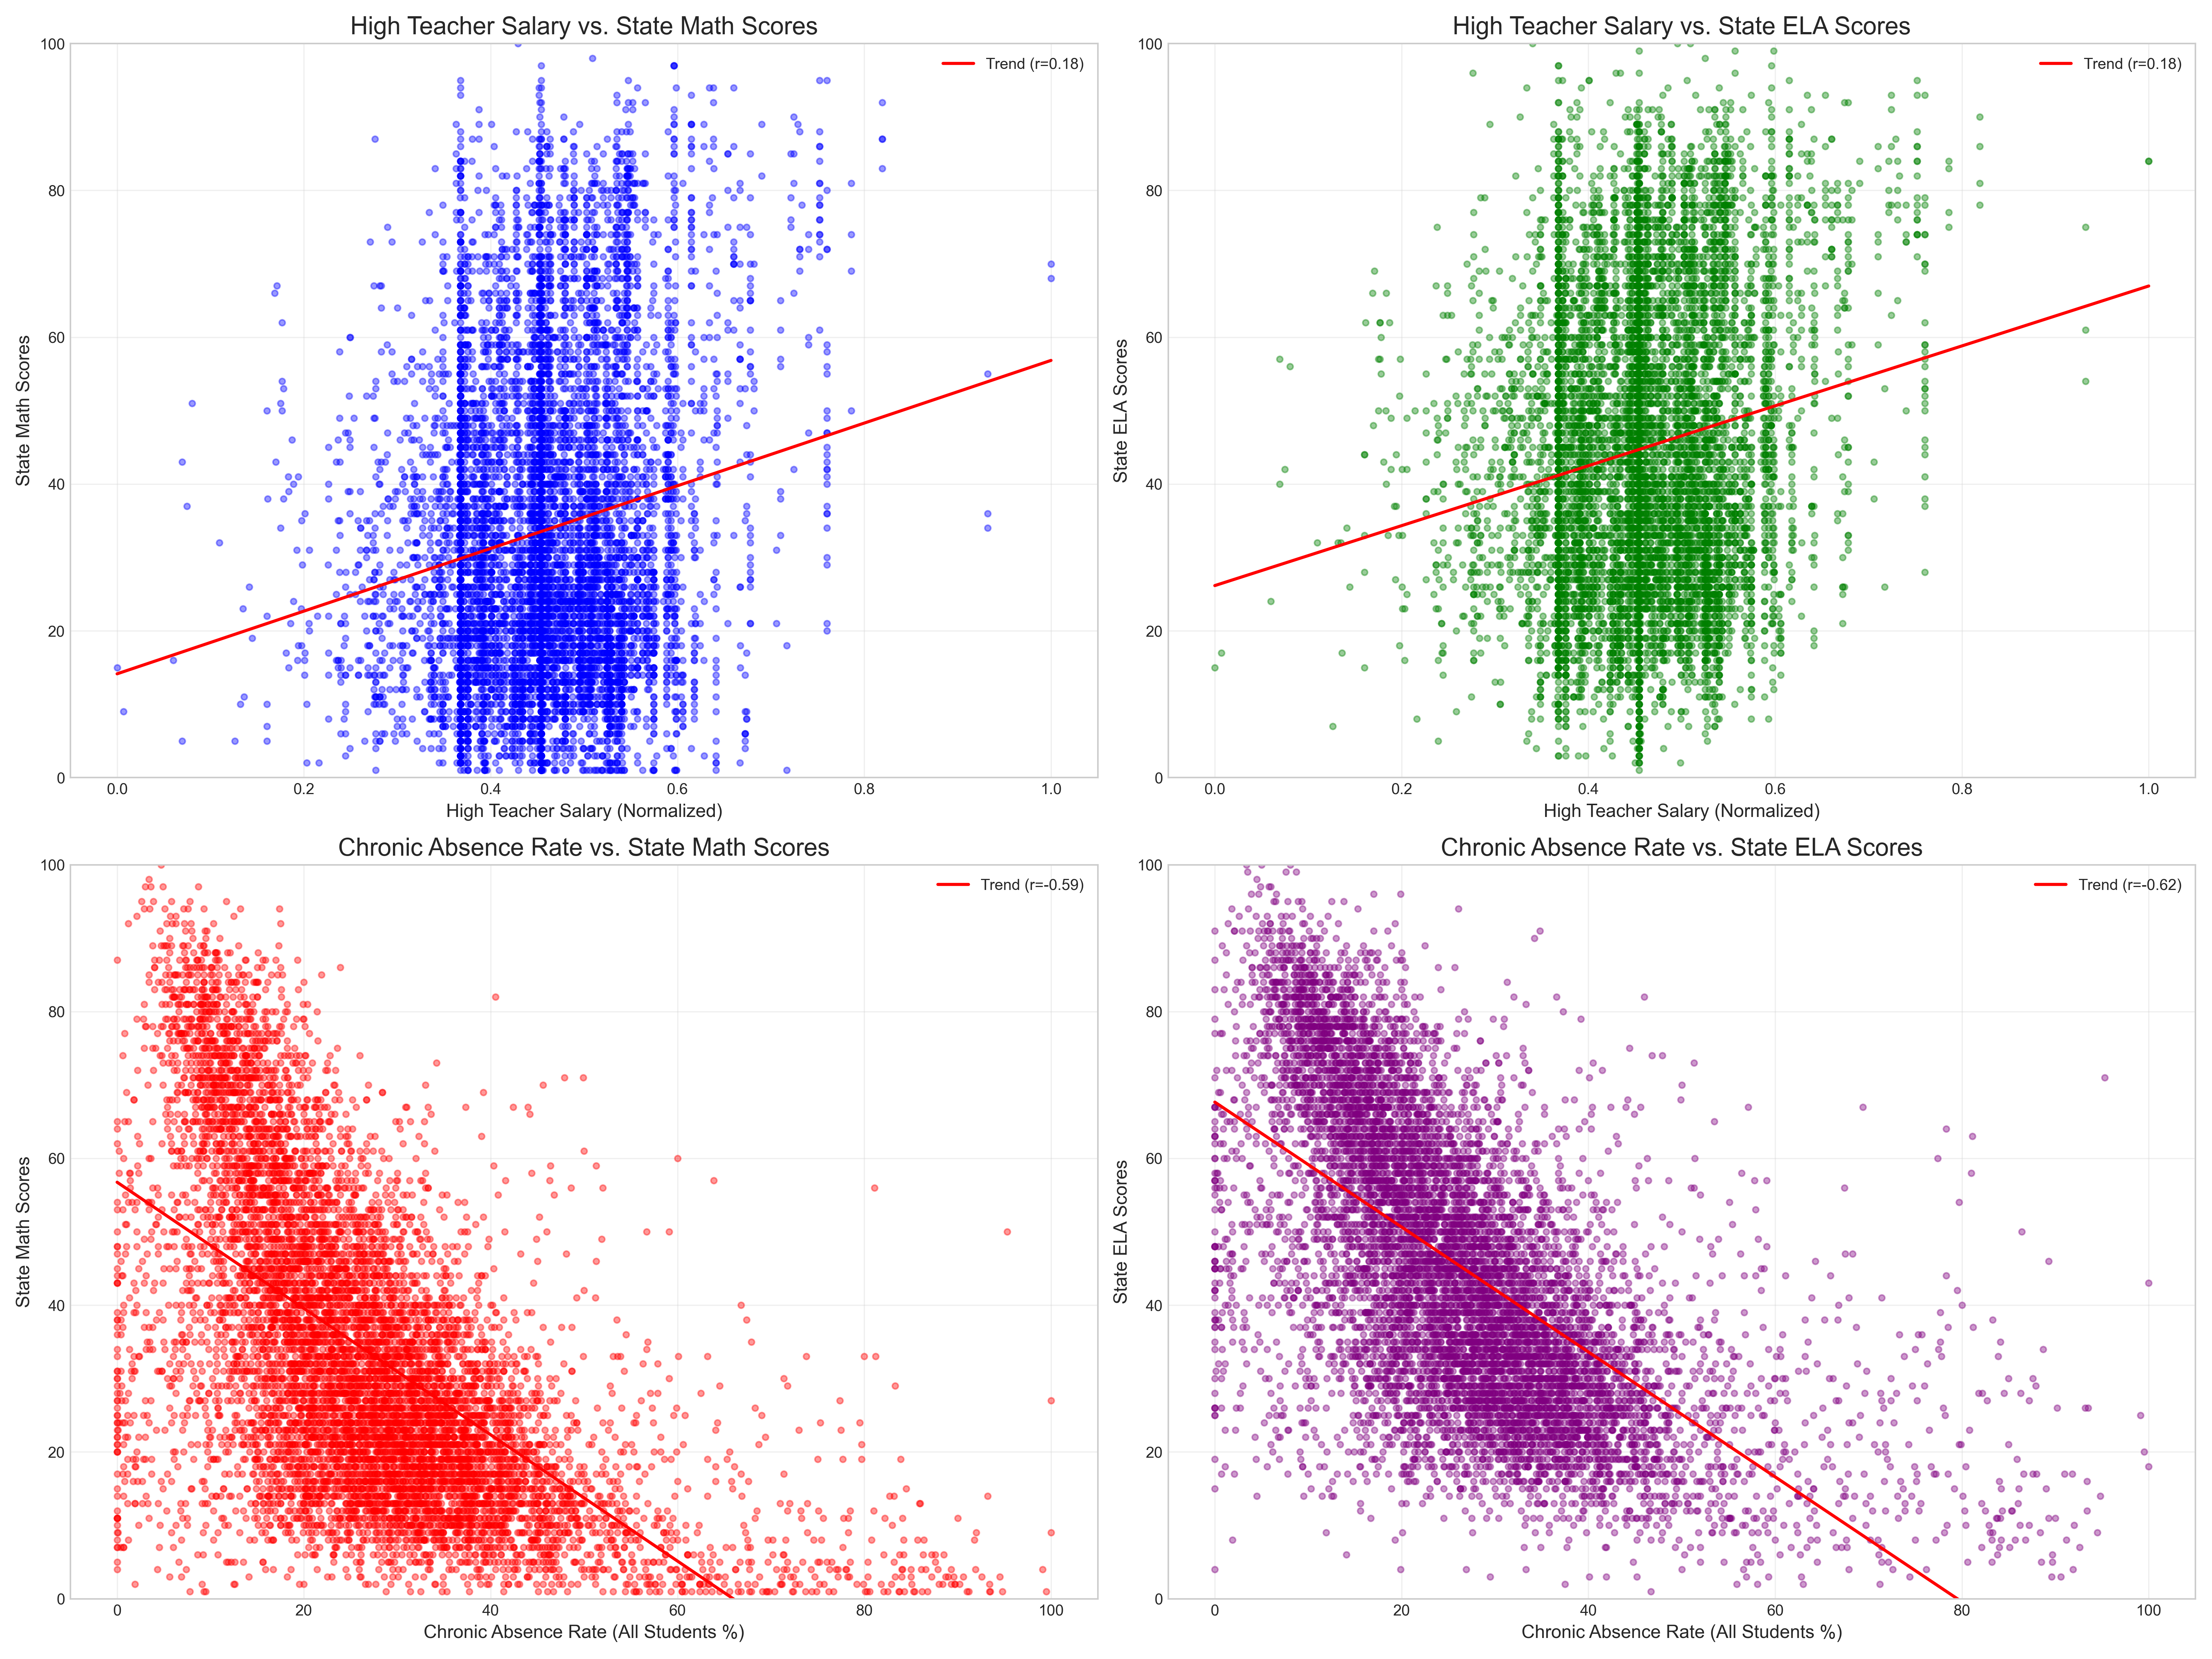
Figure 4: Scatter plots showing relationships between teacher salaries, absence rates, and test scores.
Variable Reference Guide
This reference table explains the variables used in the analysis.
| Variable | Description |
|---|---|
| CDSCODE | Unique identifier for California schools |
| DSAL | District Salary (Normalized) |
| STSAL | State Salary (Normalized) |
| BTCHSAL | Beginning Teacher Salary (Normalized) |
| MTCHSAL | Mid-career Teacher Salary (Normalized) |
| HTCHSAL | High-level Teacher Salary (Normalized) |
| SELA_Y2 | State English Language Arts Test Score |
| SMATH_Y2 | State Mathematics Test Score |
| DELA_Y2 | District English Language Arts Test Score |
| DMATH_Y2 | District Mathematics Test Score |
| PERSD | Percentage of Socioeconomically Disadvantaged Students |
| RALL | Chronic Absence Rate - All Students |
| REL | Chronic Absence Rate - English Learners |
| RSED | Chronic Absence Rate - Socioeconomically Disadvantaged Students |